glue
definition
add a key to variables in a notebook, then display those variables in your book by referencing the key.
glue function
name: book(page) 상세서 사용되는 유니크 명칭(key)
variable: jupyter notebook으로 생성된 객체(str, graph etc)
display: true/false
from myst_nb import glue
help(glue)
Help on function glue in module myst_nb:

glue(name: str, variable, display: bool = True) -> None
    Glue a variable into the notebook's cell metadata.

    Parameters
    ----------
    name: string
        A unique name for the variable. You can use this name to refer to the variable
        later on.
    variable: Python object
        A variable in Python for which you'd like to store its display value. This is
        not quite the same as storing the object itself - the stored information is
        what is *displayed* when you print or show the object in a Jupyter Notebook.
    display: bool
        Display the object you are gluing. This is helpful in sanity-checking the
        state of the object at glue-time.
usecase
graph
1) drawing scatter graph
# Visualize seaborn scatter chart
import numpy as np
import seaborn as sns
import matplotlib.pyplot as plt
sns.set_theme(style="dark")

# Simulate data from a bivariate Gaussian
n = 10000
mean = [0, 0]
cov = [(2, .4), (.4, .2)]
rng = np.random.RandomState(0)
x, y = rng.multivariate_normal(mean, cov, n).T

# Draw a combo histogram and scatterplot with density contours
f, ax = plt.subplots(figsize=(4, 4))
sns.scatterplot(x=x, y=y, s=5, color=".15")
sns.histplot(x=x, y=y, bins=50, pthresh=.1, cmap="mako")
sns.kdeplot(x=x, y=y, levels=5, color="w", linewidths=1)

glue("scatter_graph", f, display=False)
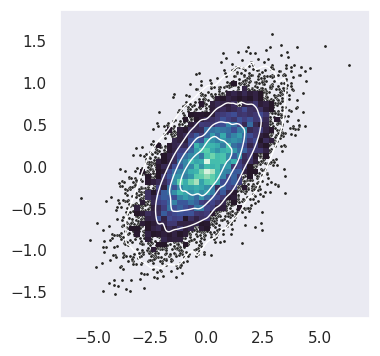
2) display the graph
binding the graph(f) in in-line text(markdown)
In-line text; a figure: {glue:}`scatter_graph`.
In-line text; a figure:
table
1) dataframe
import numpy as np
import pandas as pd
import seaborn as sns

df = sns.load_dataset("titanic")

df.style.set_table_attributes('style="font-size: 10px"')

glue('df_tbl', df.head())
| survived | pclass | sex | age | sibsp | parch | fare | embarked | class | who | adult_male | deck | embark_town | alive | alone | |
|---|---|---|---|---|---|---|---|---|---|---|---|---|---|---|---|
| 0 | 0 | 3 | male | 22.0 | 1 | 0 | 7.2500 | S | Third | man | True | NaN | Southampton | no | False |
| 1 | 1 | 1 | female | 38.0 | 1 | 0 | 71.2833 | C | First | woman | False | C | Cherbourg | yes | False |
| 2 | 1 | 3 | female | 26.0 | 0 | 0 | 7.9250 | S | Third | woman | False | NaN | Southampton | yes | True |
| 3 | 1 | 1 | female | 35.0 | 1 | 0 | 53.1000 | S | First | woman | False | C | Southampton | yes | False |
| 4 | 0 | 3 | male | 35.0 | 0 | 0 | 8.0500 | S | Third | man | True | NaN | Southampton | no | True |
2) display(binding) in the book
```{glue:figure} df_tbl
:figwidth: 100px
:name: 'tbl:df'

titanic dataset
| survived | pclass | sex | age | sibsp | parch | fare | embarked | class | who | adult_male | deck | embark_town | alive | alone | |
|---|---|---|---|---|---|---|---|---|---|---|---|---|---|---|---|
| 0 | 0 | 3 | male | 22.0 | 1 | 0 | 7.2500 | S | Third | man | True | NaN | Southampton | no | False |
| 1 | 1 | 1 | female | 38.0 | 1 | 0 | 71.2833 | C | First | woman | False | C | Cherbourg | yes | False |
| 2 | 1 | 3 | female | 26.0 | 0 | 0 | 7.9250 | S | Third | woman | False | NaN | Southampton | yes | True |
| 3 | 1 | 1 | female | 35.0 | 1 | 0 | 53.1000 | S | First | woman | False | C | Southampton | yes | False |
| 4 | 0 | 3 | male | 35.0 | 0 | 0 | 8.0500 | S | Third | man | True | NaN | Southampton | no | True |
Fig. 1 titanic dataset