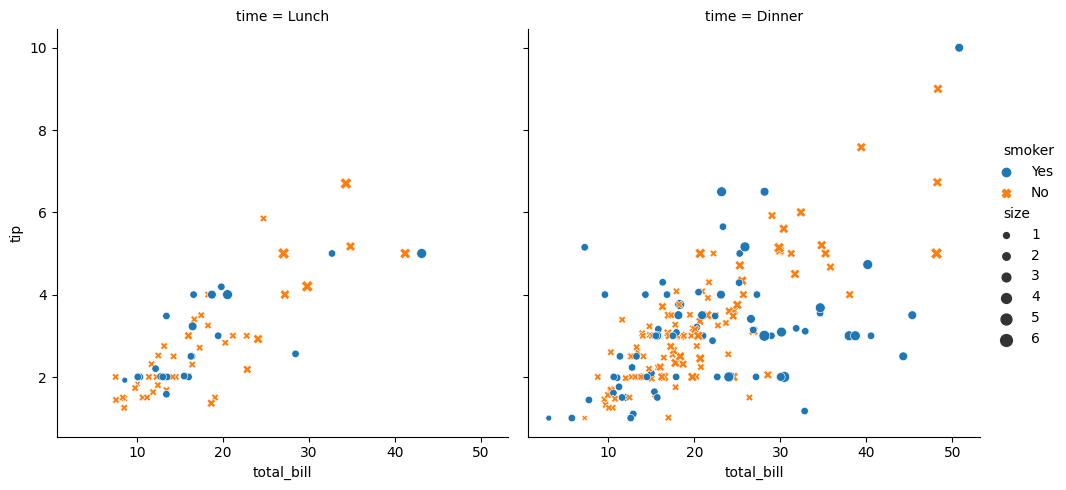
seaborn chart example¶ import seaborn as sns df = sns.load_dataset('tips') sns.relplot( data=df, x="total_bill", y="tip", col="time", hue="smoker", style="smoker", size="size" ) <seaborn.axisgrid.FacetGrid at 0x7f946a1c2440>